
Annual Consumer Price Index inflation hit 10.1% in September, but that does not mean every price is showing a double-digit increase.
Looking beyond the top line numbers can help illuminate why our personal experience of inflation can differ – for better or worse – from the headline numbers.
Significance of September CPI
The September Consumer Prices Index (CPI) inflation reading is probably the most important inflation metric in a given year. Traditionally, this number is the one used by the Government as the basis for increasing tax allowances and bands, as well as benefits – including the state pension.
In recent years the significance of September’s CPI figure has lessened, as the Government has chosen to freeze or restrict increases to limit the cost to the Exchequer of these benefits.
The most obvious recent example is the freeze to the personal allowance (£12,570) and higher rate threshold (£50,270 outside Scotland), which would be £14,270 and £57,170 from April 2023 had the first two years of a four-year freeze not happened.
Not all it seems
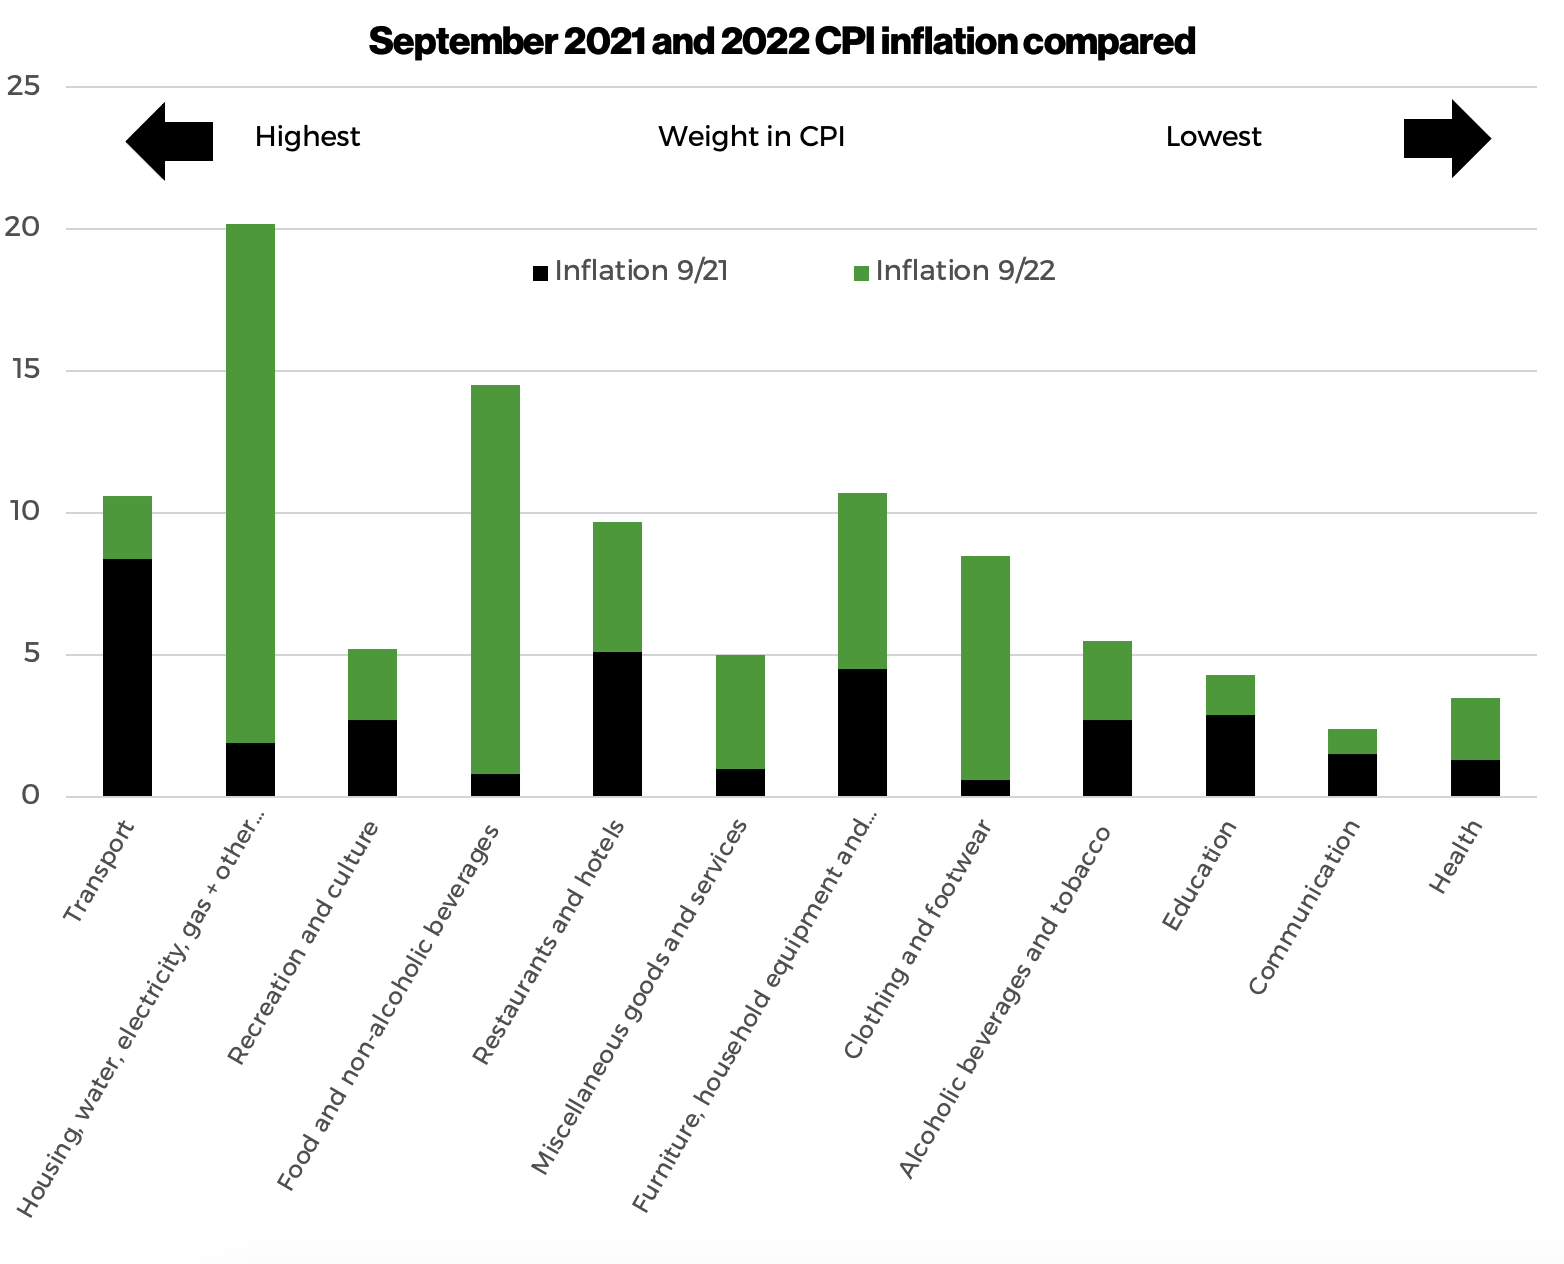
This year, the September 2022 annual inflation rate of 10.1% is more significant and not all it seems. The graph below shows the annual inflation rate in the 12 categories that make up the CPI ‘shopping basket’ of goods and services.
 Source: ONS
Only a third of those categories registered inflation above 10%, while another third recorded rises of no more than 5%.
All the categories experienced higher inflation in September 2022 than September 2021, when the annual inflation rate was a more modest 3.0%, but the changes brought about over the intervening twelve months have had significantly varied effects across the different categories:
- Housing, water, electricity, gas and other fuels inflation has increased from 1.9% to 20.2%, due to the war in Ukraine, resulting in soaring energy bills. This category is shortly expected to see another jump, as the Government’s new energy price guarantee took effect from 1 October.
- Food inflation increased from 0.8% in 2021 to 14.5% in 2022, also largely as a consequence of the war in Ukraine. Not only has the war affected the production of grain and sunflower oil, directly increasing their prices, but the higher cost of fossil fuels – used in transportation and in fertiliser manufacture – has exacerbated the price increase.
- At the other end of the scale, however, the communications category, primarily telecoms, is experiencing only 2.4% inflation (albeit in 2021 the corresponding figure was 1.5%). Health (medical, hospital and outpatient services) has also seen only a modest rise, from 1.3% to 3.5%.
Differing experience of inflation
These large variations between the categories help to explain why your experience of inflation may seem, at different times, better or worse than the headline figure.
The Office for National Statistics (ONS) has recently launched an online personal inflation calculator that can help you better understand, based on your lifestyle, how inflation is likely to affect you.
If you would like further support in adapting your financial plans to take into account the impact of inflation, please get in touch.